Insights
What a century of capital market data teaches us!
A study of US markets data over the last 100+ years across asset classes
In this article
- Returns over last 100 years: equity comfortably beats all asset classes
- Takeaway #1: Asset allocation is crucial
- Takeaway #2: Small caps out-perform large-caps : Size Premium is a reality
- Takeaway #3: Macro factors do impact performance : For US, Inflation becomes a key factor in Valuations & Returns
- Takeaway #4: Market declines can be brutal and long - need to be prepared
- Takeaway #5: The Long-Term Nature of Equities – Why Long-term investors usually don’t have to worry
- Conclusion
“History Doesn’t Repeat Itself, but It Often Rhymes” - Mark Twain
It is important to know the past so that we can use it to better understand the present & future. A century long history of asset classes like Equities, Bonds, Real Estate and Gold, can tell us a captivating story. Hence, we went through 100+ years of US market data to see what insights can we draw from it - some obvious, some unusual…let’s get into it!
Returns over last 100 years: equity comfortably beats all asset classes
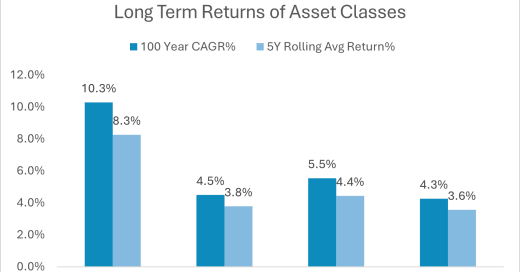
Returns delivered by different asset classes in the graph below - Debt & Real Estate have broadly given similar returns, Gold slightly better and Equity outperforms by a margin.
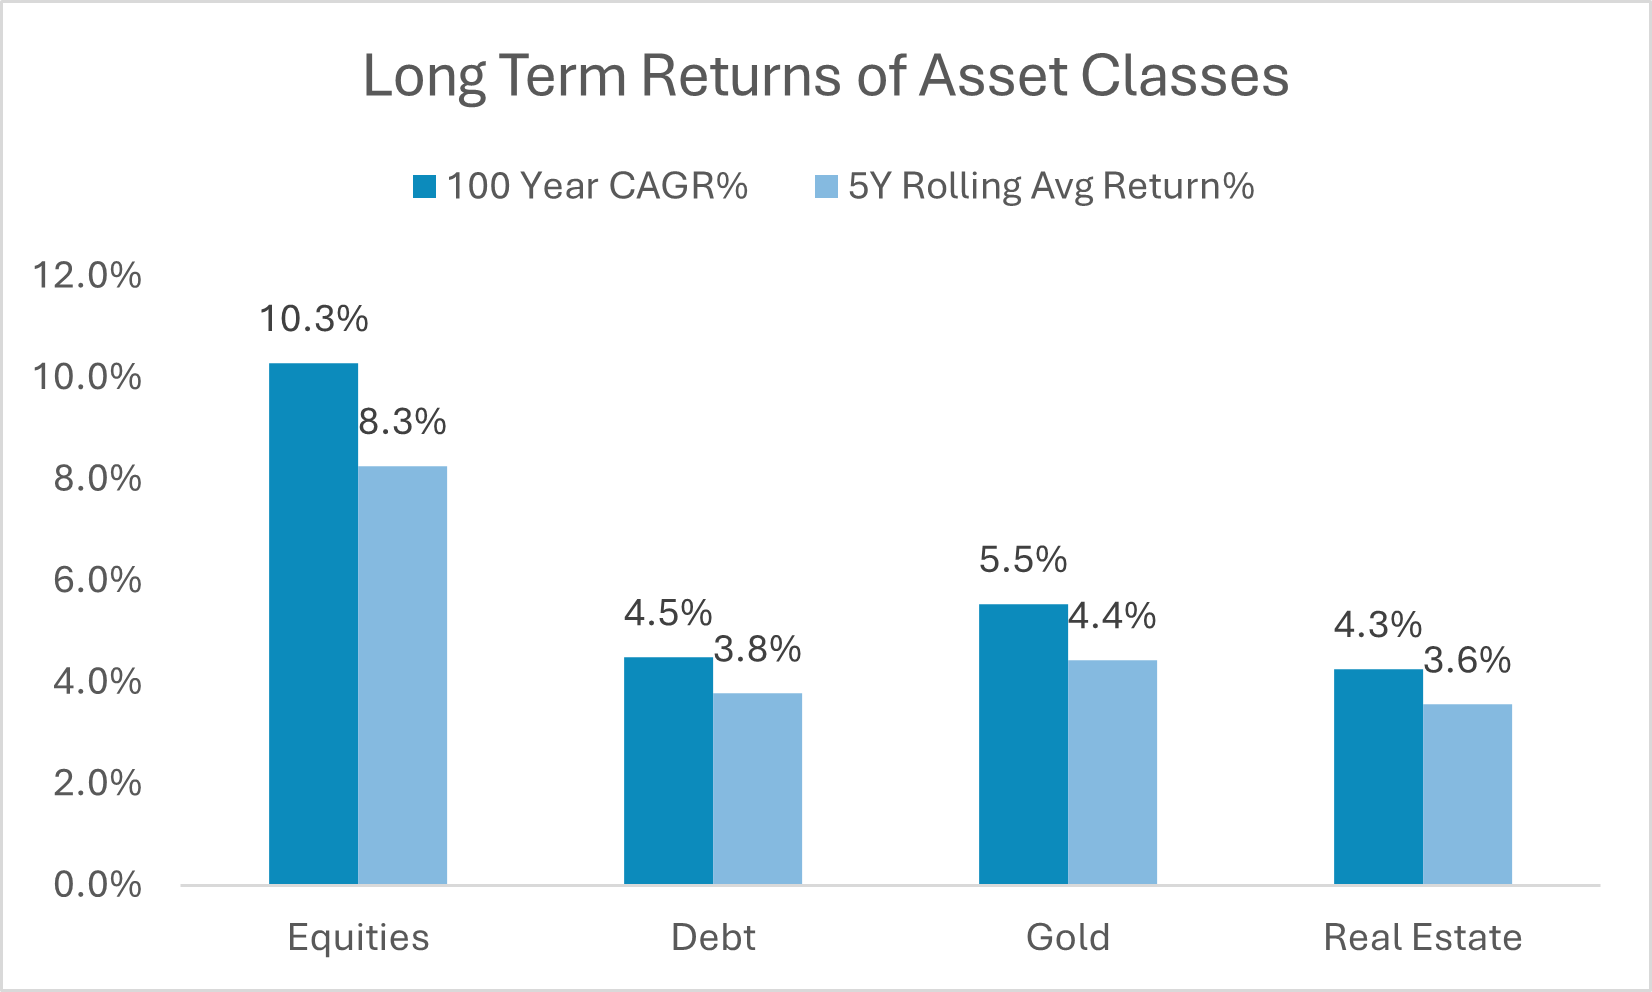
Equities include dividends re-invested and are represented by S&P500 index data. Data prior to 1957 for the S&P is backfilled using comparable broad benchmark indices.
When one looks at the above graph, one may think well Equity is just ~2x better in return terms - but when you look at absolute values, the impact of compounding over 100 years is actually visible. $100,000 invested 100 years back would become following values today (in nominal terms) :
Real Estate → $ 5.6 million
Debt → $ 7.4 million
Gold → $ 18.7 million
Equities → $1.3 Billion (its not a typo, its with a B!)
Hence they say that compounding is the 8th wonder of the world!
This is one side of the equation, let’s also look at volatility for each of them:
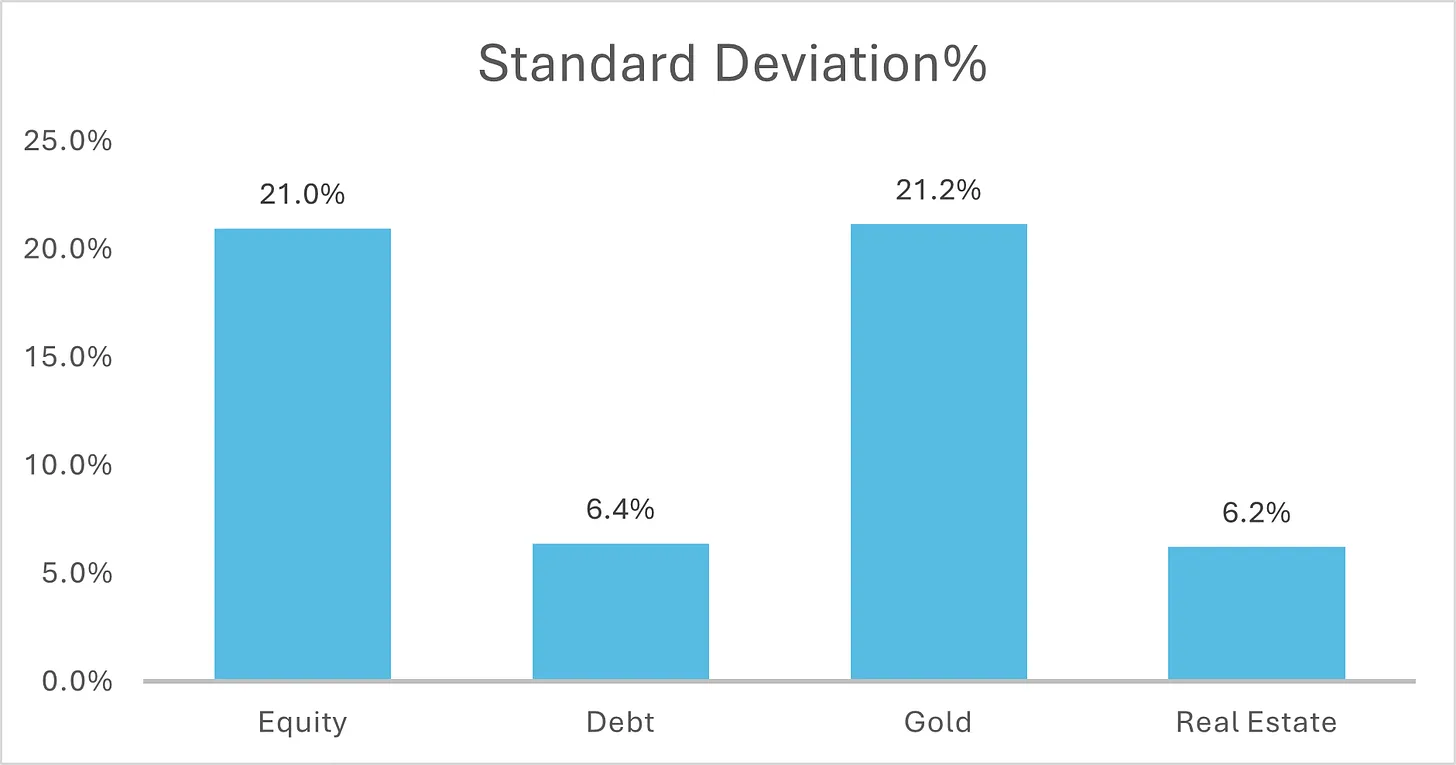
The recent gold rally has made everyone interested in gold - but we should not forget that (1) Equities out-performs gold in the long-term and (2) While Gold is better than Debt & RE, but it also comes at much higher volatility - almost similar to Equities.
Ok I know, all that is good, but who is living a 100 years to be Billionaire - we are not Buffet either in terms of intelligence, temperament or life expectancy! Even with the genius of Musk and all the biotech advancements put together, our adult life is not going to be a 100 years anytime soon…so beyond a point looking at returns over that period is meaningless, right! So let’s dissect it across different periods & factors to see what key takeaways can we learn.
Takeaway #1: Asset allocation is crucial
Returns across asset classes by decades:
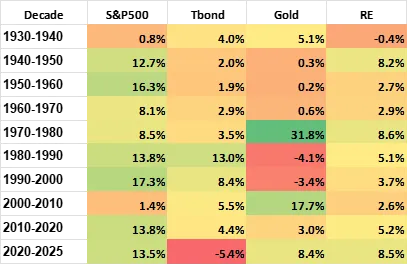
As we can see, different decades have been dominated by different asset classes - Equities has massively under-performed in 1930s, 1970s, 2000s.
When we look at performance rankings based on annual returns → Equities is the top performing in ~47 years, but also for balance ~53 years either of the other 3 asset classes did give better returns than Equities.
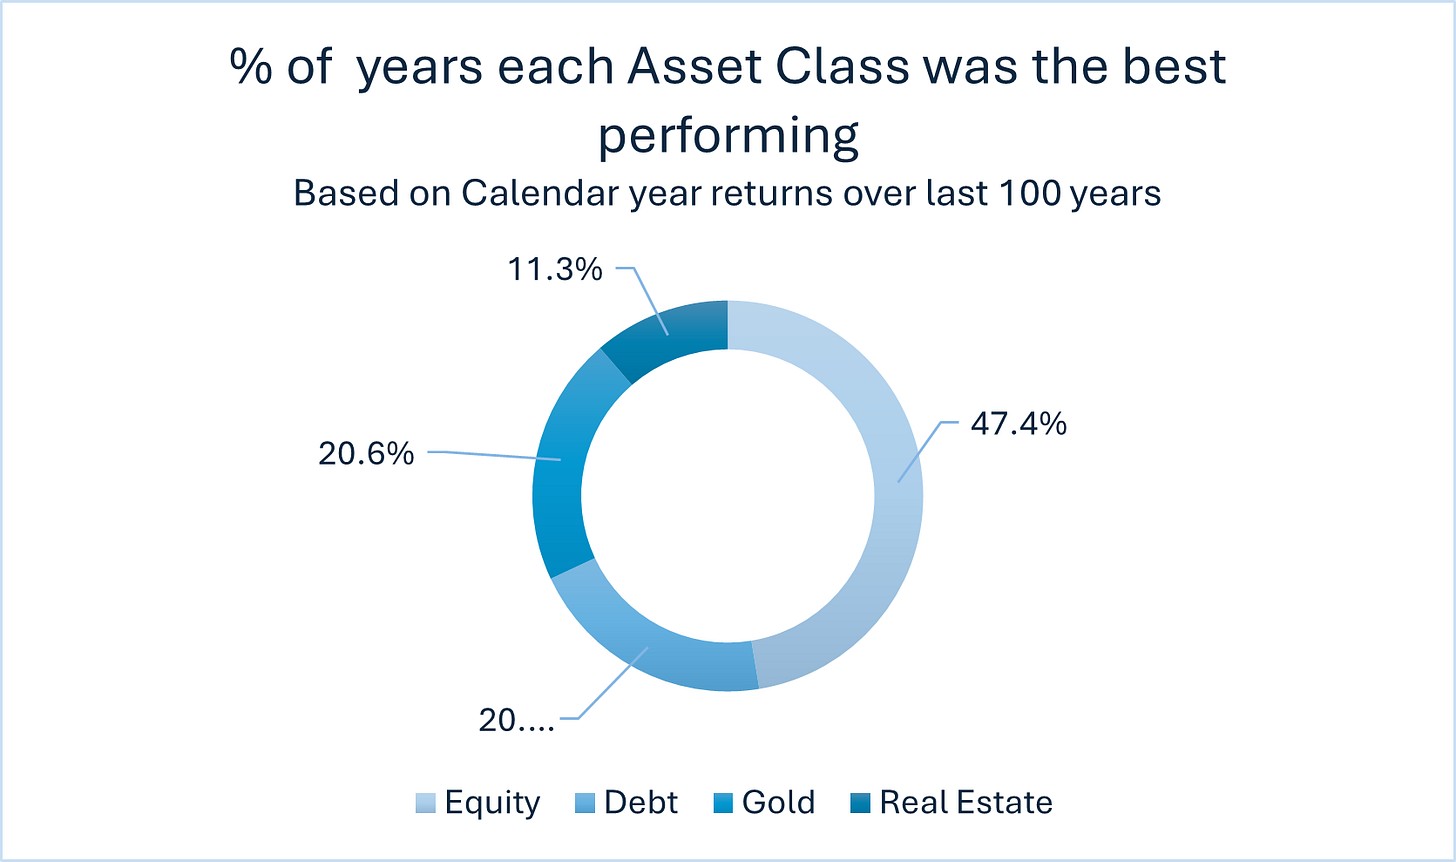
Portfolio Tip: Given the above and given for most investors, the time frame is a few years or couple of decades, it implies that asset allocation is crucial. The weightage to each asset class will obviously depend on one’s risk profile & goals and the current macro & markets situation. Hence, its important to track all asset classes and allocate based on risk-reward set up of the market at the time!
Takeaway #2: Small caps out-perform large-caps : Size Premium is a reality
We test if the hypothesis of Size Premium i.e. smaller companies giving higher returns than large companies holds true - and fact is it does. Small-cap returns over the test period have been ~11.3% vs Broad markets at 10.3% - small caps out-performed Broad markets roughly ~64% of the times.
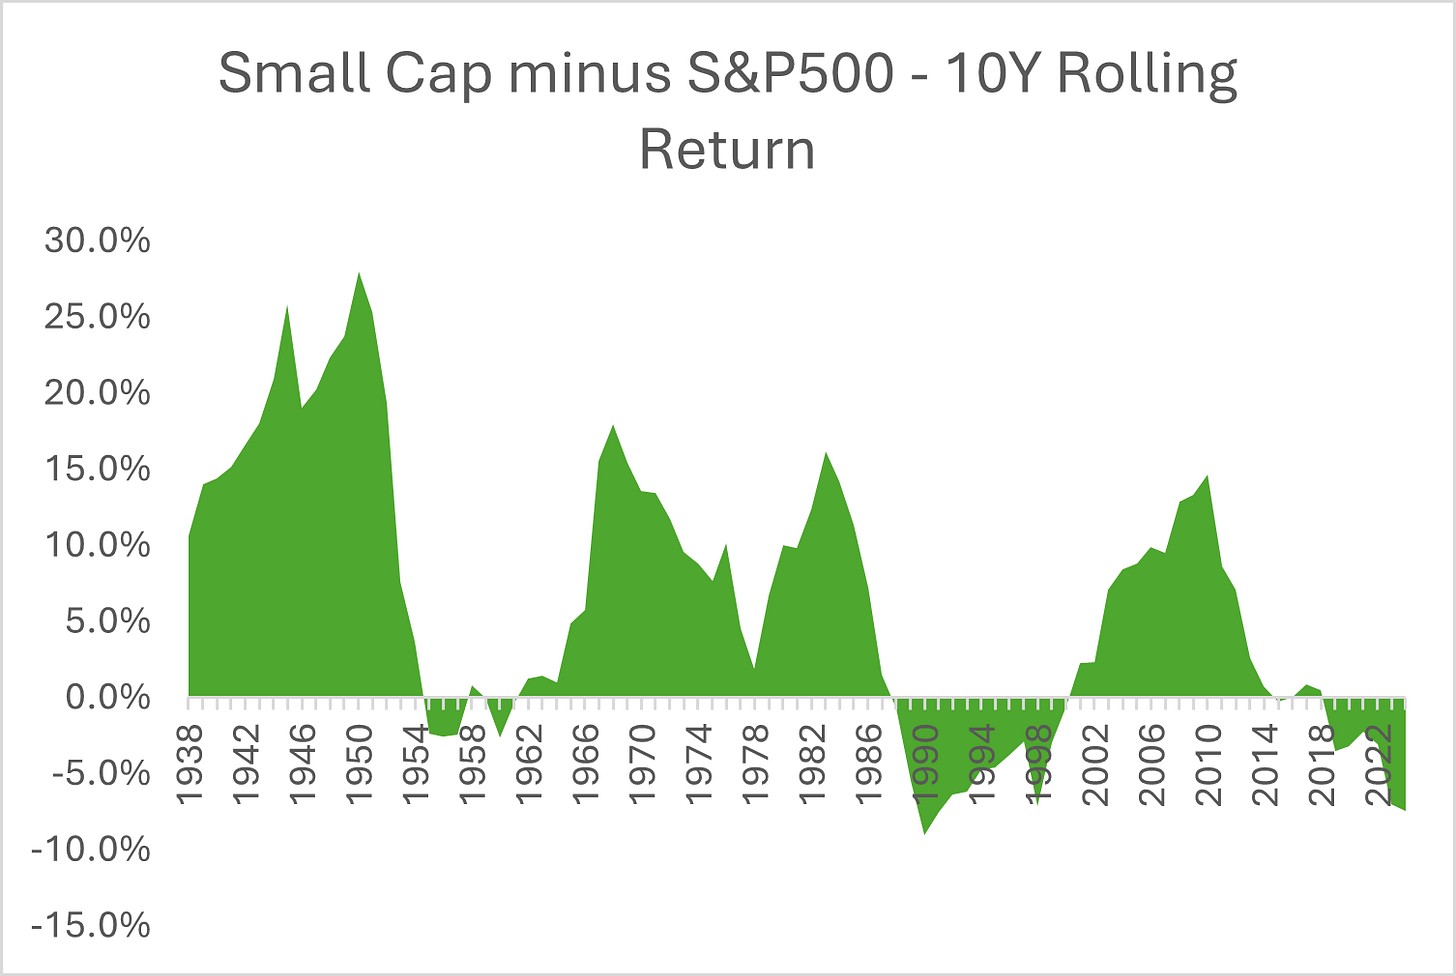
However, this has come at a much higher volatility, as expected : Standard Deviation of ~38% vs broad markets at 21%.
Now, dissecting the periods of under and over performance of small-caps:
Under-Performance: In extreme bull phases when the top companies are leading from the front such as 1950s and early 60s industrial boom and the ‘Nifty Go Go years’; 1990s Dot Com Boom; 2010 till now - Post GFC, FAANG / Tech/ AI boom.
Over-Performance: US Small-caps over-performance broadly coincides with EM over-performance vs US too: because ideally both would do well when headline sentiment & macros in US is not strong. 1930s: post the Great Depression, 1940s: World War II; 1970s & 80s: Korea rising, Japan boom; 2000s China boom and Commodities cycle.
Portfolio Tip: Within Equities also critical to have a mix across market caps. Everything does not do well all the time - there are distinct periods for small caps vs large caps out-performance - important to understand & monitor that and have portfolio weightage accordingly.
Takeaway #3: Macro factors do impact performance : For US, Inflation becomes a key factor in Valuations & Returns
Do Macros matter for markets? While they may not on a day-to-day and stock-specific level, on an aggregate and over a medium-term period, there is definitely a strong correlation. All macro indicators invented by mankind ofcourse don’t have much relevance, but for each country at a given time, one or two factors drive company’s earnings and capital flows and so eventually stock prices.
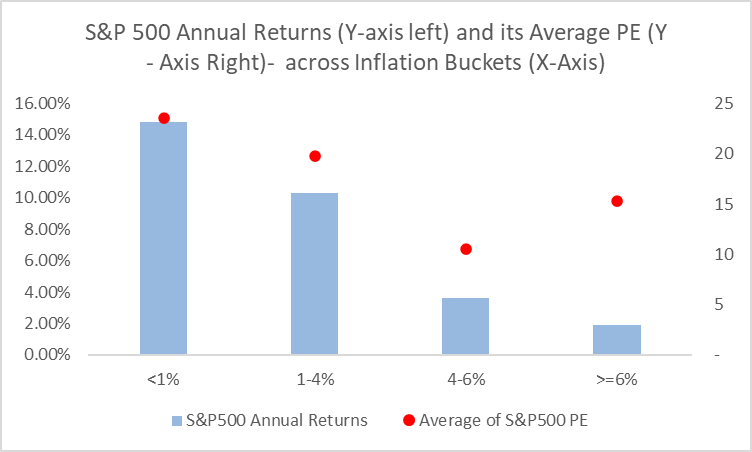
We look at how inflation in US directly impacts valuations for companies & stock price returns. As can be seen in the graph below:
Low and Stable Inflation → Corresponds with higher PE multiples for companies and better stock returns
High Inflation → Low PE multiples and negative to below average equity returns
Portfolio Tip: Macro indicators and ratios can help in better positioning of our portfolios. There are over a dozen such indicators - key is to know which is relevant and when! For instance, in India, more than inflation it is Dollar Index (DXY) which has had a strong correlation with equity returns - partly driven by our historical over-reliance on FII Flows. But that is changing now and also Dollar is losing its shine, so going forward will DXY still be as relevant or we need to track something else more important?
Takeaway #4: Market declines can be brutal and long - need to be prepared
“Invert, always invert. All I want to know is where I’m going to die, so I’ll never go there.” - Charlie Munger
Market declines in US over the last century have happened for a variety of reasons from wars, pandemics, high inflation, bank crisis, etc. As Charlie Munger put it, if we know what is going to kill our portfolio - we can be aware and better prepared for it.
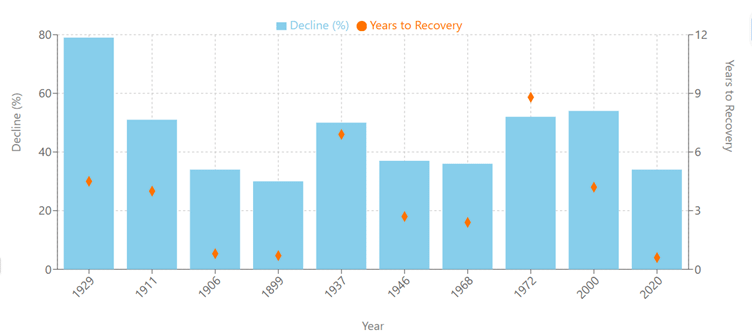
The below image from Morningstar very well illustrates the various bust events over the last 150 years.
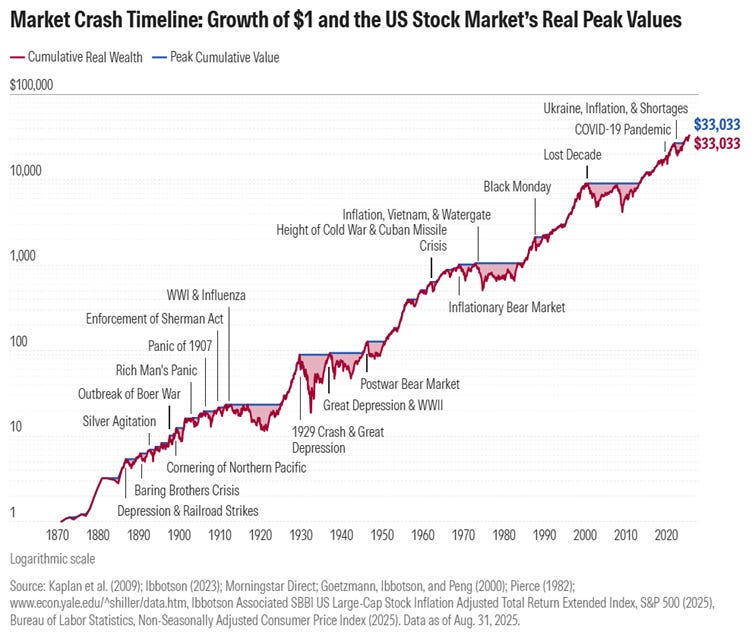
Below chart shows the % decline and years to recovery over the top 10 worst declines - the maximum decline has been 79% (!!) during the 1930 Great depression and maximum years to recovery has been almost 10 years during the 1970s inflationary bear market. Imagine a 10 year period of sideways to bearish market!
Portfolio Tip: As Peter Lynch rightly said: “Everyone has the brainpower to make money in stocks. Not everyone has the stomach.” Temperament is the key differentiating investor attribute in the market, even more than intellect. Being prepared for bear markets, both financially & emotionally, is crucial - it means not selling in panic, having some cash to buy at bargain prices, having emergency funds to meet few year’s expenses during portfolio drawdowns and not loosing conviction & sleep.
Takeaway #5: The Long-Term Nature of Equities – Why Long-term investors usually don’t have to worry
While Equity participation in India has improved over recent years, but is still significantly low. If you ask someone who is not invested into equities or has a very low allocation on their reason - the main one you might hear is : ‘markets ka kya bharosa, kabhi bhi badhta hai, kabhi bhi girta hai…humko aaram ki neend chahiye’
Well, the fact is true - markets are highly volatile & the declines can be brutal as we saw in point #4 above. But if we just zoom out a bit, and go from annual to say a 10 year view (not 100, just 10!) the whole picture changes. Over a 1 year period, the ‘worst’ for Equities was a -44% decline (ouch!); but over a 10-year period the ‘worst’ for Equities in a century is -2% decline. Over a 30-year period gets even better : its +8% annually! Below chart beautifully illustrates the best & worst returns over different periods of time:
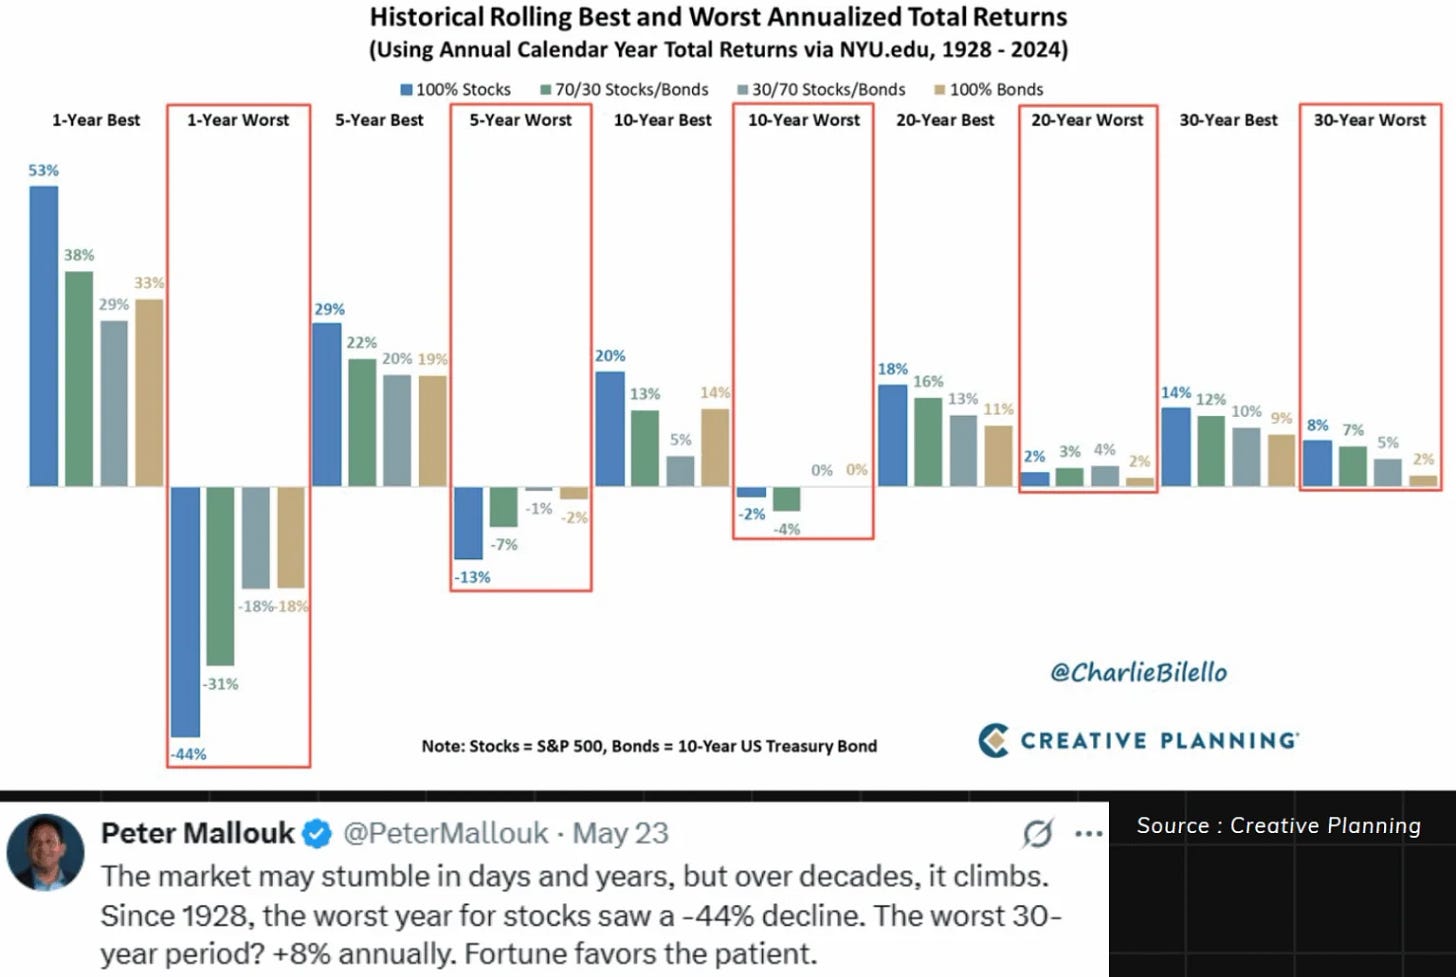
Portfolio Tip: The distinctive virtue of equity investing is that over the long-term it drives the probability of capital loss to Zero! Hence, we need to stop being driven by the next Big thing & stock ‘tips’ & fancy F&O strategies, and in fact just focus on being a patient investor for the long-term.
Conclusion
We should use some of the above learnings, which we all know, into our portfolio construction and diligently ensure its execution.
We also used some of the above takeaways to back-test a quant portfolio for US over 100 years, which is across asset classes with allocation rules pre-defined basis the then macro & market conditions - and we could create such portfolios which gave better returns than benchmark equity indices at much lower volatility. We will talk about it in our next blog - to avoid making this too lengthy.
Till then, happy reading and happy investing!